With the introduction of Heart Rate monitoring into Sphere Fitness it may be worth explaining how best to use this tool and what you can get out of it for best results. In this article we explore what the colours mean, what the data means and how you can learn to interpret and see improvements in your health and fitness.
A bit of background on Heart Rate
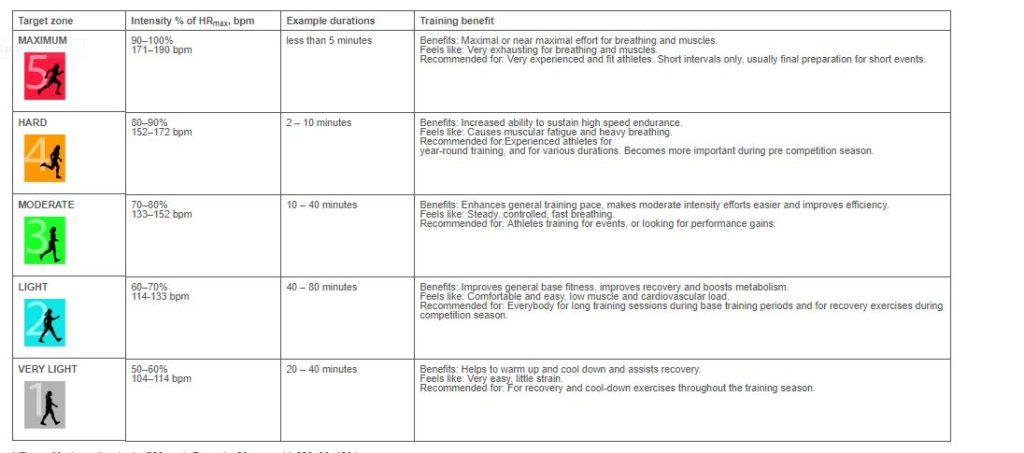
Our heart rate monitoring system that we use with trainees has a simple, easy to understand and colour co-ordinated system of progression.
The most basic way of determining what your heart rate load is via the formula 220-age. So for a 40 year old they would have a maximum heart rate of 180 beats per minute. Someone looking to work out at 70% would then shoot for 126 beats per minute.
There are other formulas which also take into account your resting heart rate.
So the same 40 year old with a resting heart rate of 55 beats per minute using the Karvonen Method would be calculated by (Max Heart Rate – Resting Heart Rate) x % intensity + Resting Heart Rate. In the same case a 70% intensity would be then calculated as 155 beats per minute.
The algorithm that places you in each zone is given a colour and factors into consideration your age, height, weight and training status with the Polar System.
There are other factors and ‘how you feel’ is also important to consider. When you wear a heart rate monitor it provides you with immediate game changing feedback.
Introducing the Zones
Zone 1 represents 50-60% of your max heart rate and is where you should be in your warm up, cool down and recovery periods. This is white.
Zone 2 represents 60-70% of your max heart rate and is considered an average effort that is easy to hold a conversation. In this case it is like you performing a long slow distance run. This is blue.
Zone 3 represents 70-80% of your max heart rate. This time the tempo is higher and the effort more pronounced. It would still be ok to hold a conversation, but only just. This is green.
Zone 4 represents 80-90% of your max heart rate. This is hard effort but you are still able to sustain it…just. This is yellow,
Zone 5 is as high as it can go and represents 90-100%. This is represented by the red zone.

The Fat Burning Zone?
Most fat burning is acknowledged as being the result of staying in zones 1 and 2. Most of the calories you are burning during this exercise is from fat. The higher the zone the more this turns to using stored sugars as your source of energy (yellow and red).
The blue and green zones are also great for beginners allowing you to perform comfortable bouts of training regularly at a pace that is not too stressful on the body.
It is also great for building up a road network of blood vessels to transport that all important oxygen and other key nutrients around the body.
Think the road network of Dublin (vast and dense) compared to that of Leitrim (one road in, one road out). After a few weeks of training there are more roads (blood vessels) in Leitrim making it a high value network for those cars (nutrient molecules) to travel on.
You will notice this a couple of ways during your training and via your heart rate monitor.
Take your resting heart rate over the a course of a few days. This should start to come down
Week 1 – 70 beats per minute (average over 4 days)
Week 2 – 68 beats per minute (average over 4 days)
Week 3 – 65 beats per minute (average over 4 days)
Week 4 – 60 beats per minute (average over 4 days)
Week 5 – 60 beats per minute (average over 4 days)
Week 6 – 55 beats per minute (average over 4 days)
Example improvements in cardiovascular health over 6 weeks
Then look at how you recovery during sessions. You are looking for a steep decline rather than a slow drawn out one.
This is an example of the same gentleman performing exactly the same bout of work, for the same time but on different days. One shows better recovery. The other shows a more drawn out recovery. In the latter we pulled back the training slightly to ensure he trained in the sweet spot.

Sharp Drop, Nice Recovery

Drawn out recovery
Moreover, studies have demonstrated that a beginner drifting too high into the high intensity zone can lead to detrimental activity levels the following day(s) which in turn leads to less calories burned over the week.
How you may ask? Rather than be up and at em off their feet after a training session they are lying stuck to the couch because they can’t move!! They would have been better off working at a lower level and being to train subsequent days rather than do nothing at all.
NEAT is so important (an acronym describing your activity levels outside of the gym and something I have explained here) and to mistakenly lower this is a big mistake through ‘over-doing it’.
So what is the big deal with high intensity exercise and fat loss. If it burns more fat at a lower level why not just train in the lower zones? The answer lies in the calorie burn after you train.
The Calorie Number and EPOC
Energy out, as demonstrated by your calorie burn, is pretty straight forward at the lower levels. In zones 1 and 2, the train your expend energy during your session and you are done.
300 kcal down. 300 kcal done.
However, as we drift into zones 2,3,4 and 5 a clever thing happens and we label it EPOC. This is an acronym for Elevate Post Oxygen Consumption and basically means when you train at those high intensities your calorie burn doesn’t stop there. It carries on after you finish.
300 kcal down, 300 kcal done when you finish. And then an additional say 100 kcal, at an estimate, in the 24-72 hours after you finish your session.
So whilst lower intensities are great, the more conditioned you become the more you can take advantage of this effect. The only downside is that is tough and for some has to be carefully measured in its dose.
The Bigger Picture – Weekly / Monthly Reporting
And then there is keeping score and tracking. How do you know if you are improving?
Your resting heart rate should improve and if you are sitting around 60-70 beats per minute at rest you would likely benefit from training held in the zones 1 and 2. This should begin to drop over time.
If you are can move up to the higher zones then we look for heart rate recovery.
Downloading the Polar Beat app and using the Fitness Test can be a great way of seeing improvements adding to your motivation.
Some can be deduced from how quickly you recover from intense bouts. Your coach will often speak about how fast you can drop to 130 beats per minute in 1 minute after an intense bout.
With the Polar system you are given a calorie number which in Sphere equates to 1 point.
If you have just performed a workout in 30 minutes and hit 275 kcal for the day and the same time next week you hit 300 kcal then that is progress.
Using the Polar flow account is a great tool for this and we can see your progress if you hook us by following the instructions detailed here
As a side note and those looking to delve a bit deeper the app using Heart Rate Variability can be a useful too. Investing in a heart rate monitor is a great idea. We recommend using this is conjunction with your recovery techniques and to lower stress. As you become more conditioned, your scores using this tool improve also. More information on this can be found here at Elite HRV.
The Even Bigger Picture – this is 1 piece of the Puzzle
With all this in mind, it is worth repeating that heart rate training whilst an important and accurate tool is still one piece of the puzzle. You can can’t out train a bad diet. So whilst 300 kcal in 1 class is great, it certainly doesn’t give you a bus pass to go and eat 300 kcal of junk food.
In conclusion, invest in some form of tracking so that you can get the most from your training and not waste vital time guessing your workload.

 CLICK HERE===>


